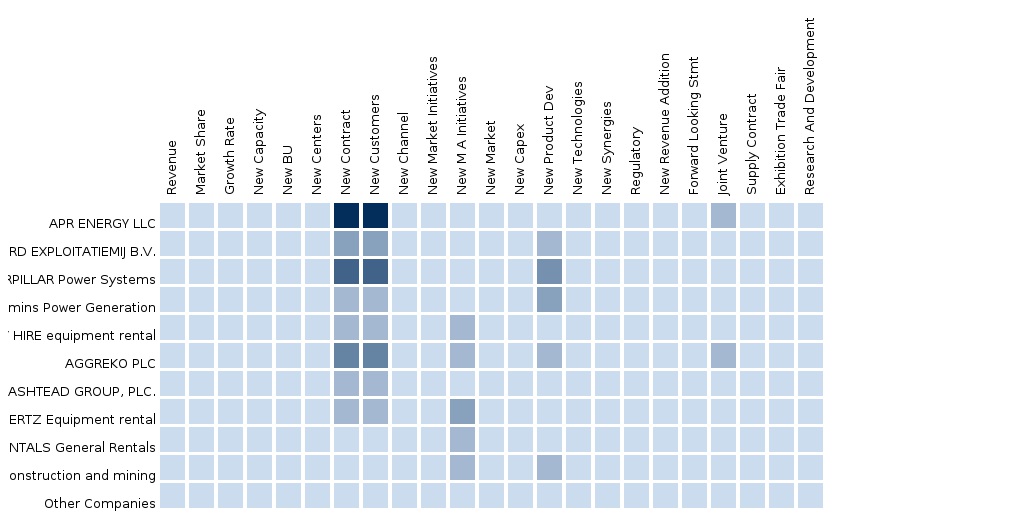
Africa Power Rental Market By application (African power rental market) & generator type (Africa power rental market) 2014-2019
The African power rental market was valued at $1.5 billion in 2013, and is projected to reach $3.4 billion by 2018 at CAGR of 17.1%. This market is segmented on basis of types and applications.
The African power rental market mainly includes diesel genset, gas genset, and other genset types. Companies operating in these segments comprise 64.5%, 25.2%, and 10.2% of the market respectively.
This market is further segmented into industies, types, and end-users.
Customization Options
Along with the market data, you can also customize the MMM assessments that meet your company’s specific needs. Customize to get comprehensive industry standards and deep-dive analysis of the following parameters:
- Key competitors
- Company profiling
- Number of power rental types installed (country level)
- Market demand forecasted as per type (ME sheet)
- Market demand forecasted as per PR type, country-wise (ME sheet)
- Assessment of the potential countries in this market
Product Analysis
- Comparison of service portfolio of each company
- Key upcoming project analysis
- Technological update analysis
Macro Data
- Increase in end-user awareness of rental benefits
- Economic slowdown
- Factors inhibiting capital expenditure
- Increase in the demand for global energy
- Infrastructure development
1 Executive Summary
2 Introduction
2.1 Objectives Of The Study
2.2 Market Definition
2.3 Market Coverage
2.4 Stakeholders
2.5 Research Methodology
2.5.1 Approach
2.5.2 Market Size
2.5.3 Key Secondary Sources
2.5.4 Key Primary Sources
2.5.5 Macro Indicators Affecting The Market
2.6 Assumptions
2.6.1 Cost Trends
2.6.2 Demand For Power Rental Services
2.6.3 Exchange Rates and Currency Conversion
2.6.4 Future Investment Trends
2.6.5 Table Totals
2.6.6 Currency Value
2.6.7 Company Financials
2.7 Acronyms
3 Market Dynamics
3.1 Introduction
3.2 Drivers And Restraints
3.2.1 Drivers
3.2.1.1 Increase In Power Demand
3.2.1.2 Lack Of Grid Stability And Support
3.2.1.3 Insufficient Generation Capacity, Especially In African Countries
3.2.2 Restraints
3.2.2.1 Limited Product Range
3.3 Auxilary Factors
3.3.1.1 Increase In Power Demand
3.3.1.2 Regulatory Issues For The Power Rental Industry
3.3.1.3 Major Players – Market Share Analysis ( Fleets)
3.3.1.4 Oil And Gas
3.3.1.5 Industrial
3.3.1.6 Quarrying And Mining
3.3.1.7 Construction
3.3.1.8 Power Generation Rental Market: Analysis Split
4 Power Rental Market- African market,by End-User Industry, 2012 – 2019
4.1 Overview
4.2 African market, by End-User Industry
5 Power Rental Market- African Market, by Generator Type, 2012 – 2019
5.1 Overview
5.2 Market, By Generator Type
6 Power Rental Market- African Market, By Application, 2012 – 2019
6.1 Overview
6.2 Market, By Application
7 Power Rental: Competitive Landscape
7.1 Introduction
7.2 Market Share Analysis
7.3 Developements: Africa Region, By Companies
8 Africa, By Companies
8.1 Aggreko Plc.
8.1.1 Introduction
8.1.2 Products & Services
8.1.3 Financials
8.2 Atlas Copco
8.2.1 Introduction
8.2.2 Products & Services
8.2.3 Financials
8.3 APR Energy Plc.
8.3.1 Introduction
8.3.2 Products & Services
8.3.3 Financials
8.4 Cummins Inc.
8.4.1 Introduction
8.4.2 Products & Services
8.4.3 Financials
List Of Tables
TABLE 1 Macro Indicator Installed Capacity (Mw)
TABLE 2 Macro Indicator Installed Capacity (Mw)
TABLE 3 Global Power Rental Market Share, By End-Use Industry,2013
TABLE 4 World Energy Consumption, By Country Grouping, 2010–2040 (Quadrillion Btu)
TABLE 5 EU Emission Standards For Rental Generators, 2014–2019
TABLE 6 Fleet Capacity Of Generator, By Company, 2012
TABLE 7 Africa: Electricity Consumption, By Country, 2003–2010 (Billion Kilowatt-Hours)
TABLE 8 Oil Production, By Geography, 2002–2012 (Thousand Barrels Daily)
TABLE 9 Gross Domestic Product For Top 10 Countries, 2009–2012 ($Million)
TABLE 10 List Of Events Using Power Rental, 2010–2014
TABLE 11 Worldwide Mining Projects, By Geography, 2014
TABLE 12 Top 10 Construction Markets, By Country, 2009 ($Billion)
TABLE 13 Africa Power Generation Rental Market Share (%), By End Use 2014 – 2019
TABLE 14 Africa Oil & Gas Power Generation Rental Market Share (%), By Geography
TABLE 15 Africa Industrial Power Generation Rental Market Share (%), By Geography
TABLE 16 Africa Power Generation Rental Market Share (%), By Generator Type
TABLE 17 Africa Power Generation Rental Market Share (%), By Application
TABLE 18 Global Power Rental Market Share (%), By Geography, 2012–2019 ($Million)
TABLE 19 Shipping: Global Power Rental Market Share (%), By Geography, 2012–2019 ($Million)
TABLE 20 Africamarket Values, By End-User Industry, 2012 - 2019($ Million)
TABLE 21 Oil & Gas Industry, By Country, 2012– 2019 ($Million)
TABLE 22 Industrial Sector, By Country, 2012– 2019 ($Million)
TABLE 23 Market, By Generator Type, 2012 – 2019 ($Million)
TABLE 24 Market, By Application, 2012 – 2019 ($Million)
TABLE 25 Africa: Developments
TABLE 26 Aggreko Plc : Products & Services
TABLE 27 Aggreko Plc: Financials
TABLE 28 Atlas Copco: Products & Services
TABLE 29 Atlas Copco: Financials
TABLE 30 Apr Energy Plc : Prodcuts & Services
TABLE 31 Apr Energy Plc : Financials
TABLE 32 Cummins Inc.: Products & Services
List Of Figures
FIGURE 1 Market Segmentation
FIGURE 2 Research Methodology
FIGURE 3 Data Triangulation Methodology
FIGURE 4 African- Market Split: By End-User Industry (2013)
FIGURE 5 Africa- Market Size: End-User Industry 2012-2018 ($Million)
FIGURE 6 African - Market Split: By Generator Type, 2013
FIGURE 7 African- Market Split: By Generator Type, 2012–2019 ($Million)
FIGURE 8 African- Market Split: By Application, 2013
FIGURE 9 African- Market Split: By Application, 2012–2019 ($Million)
FIGURE 10 Market Share: 2013
FIGURE 11 Market Share: 2019
FIGURE 12 Aggreko Plc: Ecosystem
FIGURE 13 Atlas Copco: Ecosystem
FIGURE 14 Apr Energy Plc : Ecosystems
FIGURE 15 Cummins Inc.: Ecosystems
FIGURE 16 Cummins Inc.: Financials

Please fill in the form below to receive a free copy of the Summary of this Report
Please visit http://www.micromarketmonitor.com/custom-research-services.html to specify your custom Research Requirement


