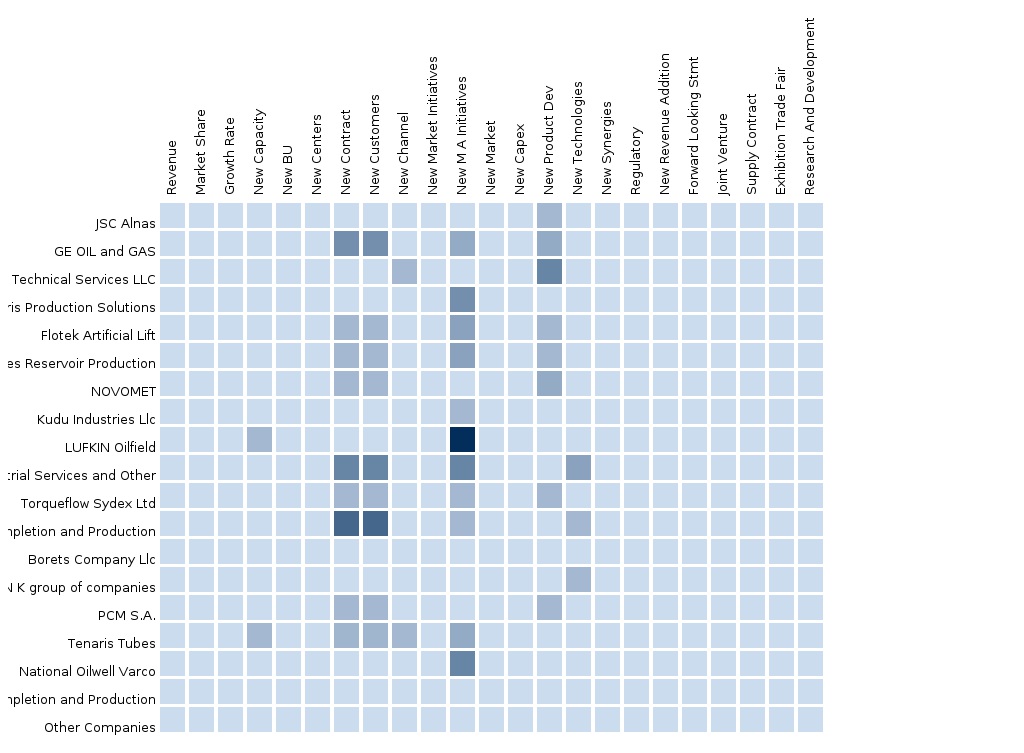
The North American artificial lift market was valued at $4694.1 million in 2013 and is projected to reach $7004.3 million in 2018, growing at a CAGR of 8.3% from 2013 to 2018.
The North American market is segmented on the basis of type, such as rod lift, ESP, PCP, gas lift, and others. The market is further segmented based on major countries, including the U.S. and Canada.
Market share analysis, by revenue, of the top companies is also included in the report. The market share analysis of these key players are arrived at, based on key facts, annual financial information, and interviews with key opinion leaders such as CEOs, Directors, and marketing executives.
In order to present an in-depth understanding of the competitive landscape, the report on the North America Artificial Lift market consists of company profiles of some key market participants including Weatherford international, Baker Hughes, Schlumberger, Lufkin, General Electric, Halliburton and Borets.
Customization Options:
Along with the market data, customize the MMM assessments to meet your company’s specific needs. Customize to get a comprehensive summary of the industry standards and a deep dive analysis of the following parameters:
Product differentiation:
- Differentiating the companies on types of artificial lift tools offered
Expert insights:
- An in-depth value chain analysis of the market
- Interrelation between the segments
- Impact of segments on the market
- Brief information about oil basins and recent discoveries
- INTRODUCTION
- OBJECTIVE OF THE STUDY
- MARKET DEFINITION AND SCOPE OF THE STUDY
- MARKETS COVERED
- STAKEHOLDERS
- RESEARCH METHODOLOGY
- INTEGRATED ECOSYSTEM OF ARTIFICIAL LIFT MARKET
- ARRIVING AT ARTIFICIAL LIFT MARKET SIZE
- TOP DOWN APPROACH
- BOTTOM-UP
- MACRO INDICATORS
- ASSUMPTIONS
- EXECUTIVE SUMMARY
- MARKET OVERVIEW
- INTRODUCTION
- PARENT MARKET COMPARISON
- DRIVERS
- RESTRAINTS
- NORTH AMERICA ARTIFICIAL LIFT MARKET, BY TYPE, 2012-2018 (USD MILLION)
- OVERVIEW
- ROD LIFT
- ESP
- PCP
- GAS LIFT
- OTHERS
- OVERVIEW
- NORTH AMERICA ARTIFICIAL LIFT MARKET, BY COUNTRY, 2012-2018 (USD MILLION)
- OVERVIEW
- U.S.
- CANADA
- OVERVIEW
- COMPETITIVE LANDSCAPE
- OVERVIEW
- MARKET SHARE ANALYSIS: BY COMPANIES
- NORTH AMERICA ARTIFICIAL LIFT MARKET: DEVELOPMENTS
- OVERVIEW
- CONTRACTS & AGREEMENTS
- EXPANSIONS
- MERGERS & ACQUISITIONS
- NEW PRODUCT LAUNCHES
- OTHER DEVELOPMENTS
- COMPANY PROFILES
- WEATHERFORD INTERNATIONAL
- BAKER HUGHES
- SCHLUMBERGER
- HALLIBURTON
- LUFKIN
- BORETS
- GENERAL ELECTRIC
List of Tables
Table 1 North America Artificial Lift market, by type, 2012-2018 (USD million)
Table 2 North America Artificial Lift market, by Geography, 2012-2018 (USD million)
Table 3 U.S. Artificial Lift market, by Type, 2012-2018 (USD million)
Table 4 Canada Artificial Lift market, by Type, 2012-2018 (USD million)
Table 5 Rod Lift Artificial Lift market, by country, 2012-2018 (USD million)
Table 6 ESP Artificial Lift market, by country, 2012-2018 (USD million)
Table 7 PCP Artificial Lift market, by country, 2012-2018 (USD million)
Table 8 Gas Lift Artificial Lift market, by country, 2012-2018 (USD million)
Table 9 Expansions, 2012-2014
Table 10 Mergers & Acquisitions, 2012-2014
Table 11 New Product Launches, 2012-2014
Table 12 Other Developments, 2012-2014
Table 13 Weatherford international: Financials
Table 14 Weatherford international: Products & Equipment/Services
Table 15 Baker Hughes: Financials
Table 16 Baker Hughes: Products & Equipment/Services
Table 17 Schlumberger: Financials
Table 18 Schlumberger: Products & Equipment/Services
Table 19 Halliburton: Financials
Table 20 Halliburton: Products & Equipment/Services
Table 21 Lufkin: Financials
Table 22 Lufkin: Products & Equipment/Services
Table 23 Borets: Financials
Table 24 Borets: Products & Equipment/Services
Table 25 General Electric: Financials
Table 26 General Electric: Products & Equipment/Services
List of Figures
Figure 1 Research Methodology
Figure 2 Data Triangulation Methodology
Figure 3 Value Chain Analysis of North America Artificial Lift Market
Figure 4 Porter’s Five Forces Analysis
Figure 5 Market Share Analysis: By Company, 2013
Figure 6 Market Share Analysis: By Company, 2014
Figure 7 Contract Agreements Analysis, 2012-2014
Figure 8 Expansions Analysis, 2012-2014
Figure 9 Mergers &Acquisitions Analysis, 2012-2014
Figure 10 New Products Launch Analysis, 2012-2014

Please fill in the form below to receive a free copy of the Summary of this Report
Please visit http://www.micromarketmonitor.com/custom-research-services.html to specify your custom Research Requirement


