1 Introduction
1.1 Objective of the study
1.2 Market Definition and Scope of the study
1.3 Markets Covered
1.4 Stakeholders
2 Research Methodology
2.1 INTEGRATED ECOSYSTEM OF Acoustic Wave Sensors-Industrial Manufacturing
2.2 ARRIVING AT Acoustic Wave Sensors-Industrial Manufacturing MARKET SIZE
2.2.1 TOP DOWN APPROACH
2.2.2 BOTTOM-UP APPROACH
2.2.3 DEMAND (CONSUMPTION) SIDE ANALYSIS
2.2.4 Macro indicators
2.3 Assumptions
3 EXECUTIVE SUMMARY
4 MARKET OVERVIEW
4.1 INTRODUCTION
4.2 COMPARISON WITH INDUSTRIAL SENSORS & SENSOR SYSTEMS (PARENT) MARKET
4.3 MARKET DRIVERS AND INHIBITORS
4.4 DEMAND SIDE ANALYSIS
4.5 VENDOR SIDE ANALYSIS
5 Acoustic Wave Sensors-Industrial Manufacturing, By Geography
5.1 RESEARCH METHODOLOGY
5.2 INTRODUCTION
5.3 VENDOR SIDE ANALYSIS
5.4
5.4.1
5.4.2
5.4.3
5.4.4
5.5
5.5.1
5.5.2
5.5.3
5.6
5.6.1
5.6.2
5.6.3
5.7
5.7.1
5.7.2
5.8
5.8.1
5.8.2
5.9 SNEAK VIEW: Industrial Sensors & Sensor Systems (Parent) Market, By Geography
6 Acoustic Wave Sensors-Industrial Manufacturing, By Company
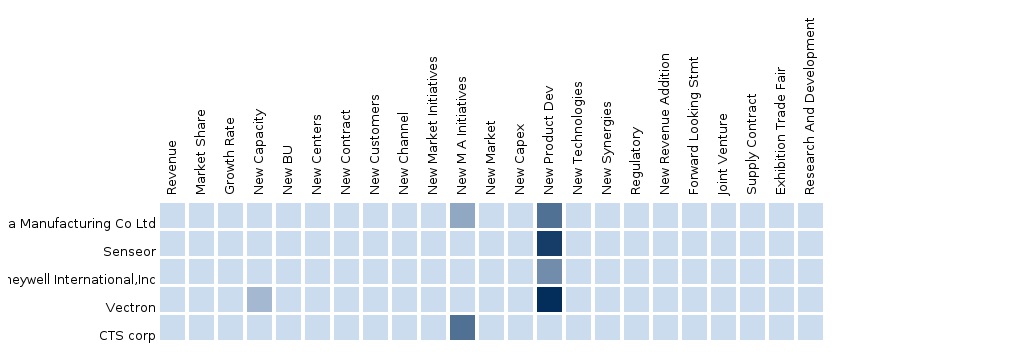
6.1 Competitive Landscape
6.1.1 Merger & Acquisition
6.1.2 Other Expansion
6.1.3 New Synergies
7 Acoustic Wave Sensors-Industrial Manufacturing, By Customer
7.1 Customers By Applications
7.2 Automotive
7.2.1 Merger & Acquisition
7.2.2 Other Expansion
7.2.3 New Synergies
7.3 Military
7.3.1 Merger & Acquisition
7.3.2 Other Expansion
7.3.3 New Synergies
7.4 Consumer Electronics
7.4.1 Merger & Acquisition
7.4.2 Other Expansion
7.4.3 New Synergies
7.5 Medical
7.5.1 Merger & Acquisition
7.5.2 Other Expansion
7.5.3 New Synergies
7.6 Industrial Manufacturing
7.6.1 Merger & Acquisition
7.6.2 Other Expansion
7.6.3 New Synergies
7.7 Other Endusers
7.7.1 Merger & Acquisition
7.7.2 Other Expansion
7.7.3 New Synergies
7.8 Volkswagen
7.8.1 Revenue Mix for 2013
7.8.2 Past Revenue Data
7.8.3 Contribution of Volkswagen to Company’s overall revenues
7.8.4 Product and Service Offerings
7.8.5 Key Developments
7.8.6 MMM Analysis
7.9 Daimler Ag
7.9.1 Revenue Mix for 2013
7.9.2 Past Revenue Data
7.9.3 Contribution of Daimler Ag to Company’s overall revenues
7.9.4 Product and Service Offerings
7.9.5 Key Developments
7.9.6 MMM Analysis
7.10 Renault S.A
7.10.1 Revenue Mix for 2013
7.10.2 Past Revenue Data
7.10.3 Contribution of Renault S.A to Company’s overall revenues
7.10.4 Product and Service Offerings
7.10.5 Key Developments
7.10.6 MMM Analysis
7.11 Fiat S.P.A
7.11.1 Revenue Mix for 2013
7.11.2 Past Revenue Data
7.11.3 Contribution of Fiat S.P.A to Company’s overall revenues
7.11.4 Product and Service Offerings
7.11.5 Key Developments
7.11.6 MMM Analysis
7.12 Toyota Motor Corporation
7.12.1 Revenue Mix for 2013
7.12.2 Past Revenue Data
7.12.3 Contribution of Toyota Motor Corporation to Company’s overall revenues
7.12.4 Product and Service Offerings
7.12.5 Key Developments
7.12.6 MMM Analysis
7.13 Lockheed Martin
7.13.1 Revenue Mix for 2013
7.13.2 Past Revenue Data
7.13.3 Contribution of Lockheed Martin to Company’s overall revenues
7.13.4 Product and Service Offerings
7.13.5 Key Developments
7.13.6 MMM Analysis
7.14 Boeing Company
7.14.1 Revenue Mix for 2013
7.14.2 Past Revenue Data
7.14.3 Contribution of Boeing Company to Company’s overall revenues
7.14.4 Product and Service Offerings
7.14.5 Key Developments
7.14.6 MMM Analysis
7.15 BAE Systems
7.15.1 Revenue Mix for 2013
7.15.2 Past Revenue Data
7.15.3 Contribution of BAE Systems to Company’s overall revenues
7.15.4 Product and Service Offerings
7.15.5 Key Developments
7.15.6 MMM Analysis
7.16 The Raytheon
7.16.1 Revenue Mix for 2013
7.16.2 Past Revenue Data
7.16.3 Contribution of The Raytheon to Company’s overall revenues
7.16.4 Product and Service Offerings
7.16.5 Key Developments
7.16.6 MMM Analysis
7.17 Airbus
7.17.1 Revenue Mix for 2013
7.17.2 Past Revenue Data
7.17.3 Contribution of Airbus to Company’s overall revenues
7.17.4 Product and Service Offerings
7.17.5 Key Developments
7.17.6 MMM Analysis
7.18 Apple Inc.
7.18.1 Revenue Mix for 2013
7.18.2 Past Revenue Data
7.18.3 Contribution of Apple Inc. to Company’s overall revenues
7.18.4 Product and Service Offerings
7.18.5 Key Developments
7.18.6 MMM Analysis
7.19 SAMSUNG ELECTRONICS CO LTD
7.19.1 Revenue Mix for 2013
7.19.2 Past Revenue Data
7.19.3 Contribution of SAMSUNG ELECTRONICS CO LTD to Company’s overall revenues
7.19.4 Product and Service Offerings
7.19.5 Key Developments
7.19.6 MMM Analysis
7.20 Hitachi
7.20.1 Revenue Mix for 2013
7.20.2 Past Revenue Data
7.20.3 Contribution of Hitachi to Company’s overall revenues
7.20.4 Product and Service Offerings
7.20.5 Key Developments
7.20.6 MMM Analysis
7.21 SONY
7.21.1 Revenue Mix for 2013
7.21.2 Past Revenue Data
7.21.3 Contribution of SONY to Company’s overall revenues
7.21.4 Product and Service Offerings
7.21.5 Key Developments
7.21.6 MMM Analysis
7.22 NIKON Corporation
7.22.1 Revenue Mix for 2013
7.22.2 Past Revenue Data
7.22.3 Contribution of NIKON Corporation to Company’s overall revenues
7.22.4 Product and Service Offerings
7.22.5 Key Developments
7.22.6 MMM Analysis
7.23 F. Hoffmann-La Roche Ltd.
7.23.1 Revenue Mix for 2013
7.23.2 Past Revenue Data
7.23.3 Contribution of F. Hoffmann-La Roche Ltd. to Company’s overall revenues
7.23.4 Product and Service Offerings
7.23.5 Key Developments
7.23.6 MMM Analysis
7.24 Abbott Laboratories
7.24.1 Revenue Mix for 2013
7.24.2 Past Revenue Data
7.24.3 Contribution of Abbott Laboratories to Company’s overall revenues
7.24.4 Product and Service Offerings
7.24.5 Key Developments
7.24.6 MMM Analysis
7.25 Novartis AG
7.25.1 Revenue Mix for 2013
7.25.2 Past Revenue Data
7.25.3 Contribution of Novartis AG to Company’s overall revenues
7.25.4 Product and Service Offerings
7.25.5 Key Developments
7.25.6 MMM Analysis
7.26 Covidien Plc
7.26.1 Revenue Mix for 2013
7.26.2 Past Revenue Data
7.26.3 Contribution of Covidien Plc to Company’s overall revenues
7.26.4 Product and Service Offerings
7.26.5 Key Developments
7.26.6 MMM Analysis
7.27 Johnson & Johnson
7.27.1 Revenue Mix for 2013
7.27.2 Past Revenue Data
7.27.3 Contribution of Johnson & Johnson to Company’s overall revenues
7.27.4 Product and Service Offerings
7.27.5 Key Developments
7.27.6 MMM Analysis
7.28 ABB LTD
7.28.1 Revenue Mix for 2013
7.28.2 Past Revenue Data
7.28.3 Contribution of ABB LTD to Company’s overall revenues
7.28.4 Product and Service Offerings
7.28.5 Key Developments
7.28.6 MMM Analysis
7.29 Emerson Electric
7.29.1 Revenue Mix for 2013
7.29.2 Past Revenue Data
7.29.3 Contribution of Emerson Electric to Company’s overall revenues
7.29.4 Product and Service Offerings
7.29.5 Key Developments
7.29.6 MMM Analysis
7.30 General Electric Company
7.30.1 Revenue Mix for 2013
7.30.2 Past Revenue Data
7.30.3 Contribution of General Electric Company to Company’s overall revenues
7.30.4 Product and Service Offerings
7.30.5 Key Developments
7.30.6 MMM Analysis
7.31 Honeywell International,Inc
7.31.1 Revenue Mix for 2013
7.31.2 Past Revenue Data
7.31.3 Contribution of Honeywell International,Inc to Company’s overall revenues
7.31.4 Product and Service Offerings
7.31.5 Key Developments
7.31.6 MMM Analysis
7.32 Rockwell Automation
7.32.1 Revenue Mix for 2013
7.32.2 Past Revenue Data
7.32.3 Contribution of Rockwell Automation to Company’s overall revenues
7.32.4 Product and Service Offerings
7.32.5 Key Developments
7.32.6 MMM Analysis
7.33 Life Technologies
7.33.1 Revenue Mix for 2013
7.33.2 Past Revenue Data
7.33.3 Contribution of Life Technologies to Company’s overall revenues
7.33.4 Product and Service Offerings
7.33.5 Key Developments
7.33.6 MMM Analysis
7.34 Thermo Fisher Scientific
7.34.1 Revenue Mix for 2013
7.34.2 Past Revenue Data
7.34.3 Contribution of Thermo Fisher Scientific to Company’s overall revenues
7.34.4 Product and Service Offerings
7.34.5 Key Developments
7.34.6 MMM Analysis
7.35 Sigma-Aldrich
7.35.1 Revenue Mix for 2013
7.35.2 Past Revenue Data
7.35.3 Contribution of Sigma-Aldrich to Company’s overall revenues
7.35.4 Product and Service Offerings
7.35.5 Key Developments
7.35.6 MMM Analysis
7.36 Promega Corporation
7.36.1 Revenue Mix for 2013
7.36.2 Past Revenue Data
7.36.3 Contribution of Promega Corporation to Company’s overall revenues
7.36.4 Product and Service Offerings
7.36.5 Key Developments
7.36.6 MMM Analysis
7.37 TAKARA BIO INC
7.37.1 Revenue Mix for 2013
7.37.2 Past Revenue Data
7.37.3 Contribution of TAKARA BIO INC to Company’s overall revenues
7.37.4 Product and Service Offerings
7.37.5 Key Developments
7.37.6 MMM Analysis
7.38 Merck KGaA
7.38.1 Revenue Mix for 2013
7.38.2 Past Revenue Data
7.38.3 Contribution of Merck Millipore to Company’s overall revenues
7.38.4 Product and Service Offerings
7.38.5 Key Developments
7.38.6 MMM Analysis
8 APPENDIX